After a week at WWDC, I wasn’t quite ready to dive into the latest and greatest technologies (my brain is still processing all that information), so I decided to spend a little time on Deja IIx. You can click to see the full-sized images.
For fun, I thought I would show off some pics of the Debugger, which is pretty much complete. The console shows disassembled code, memory dumps and such.

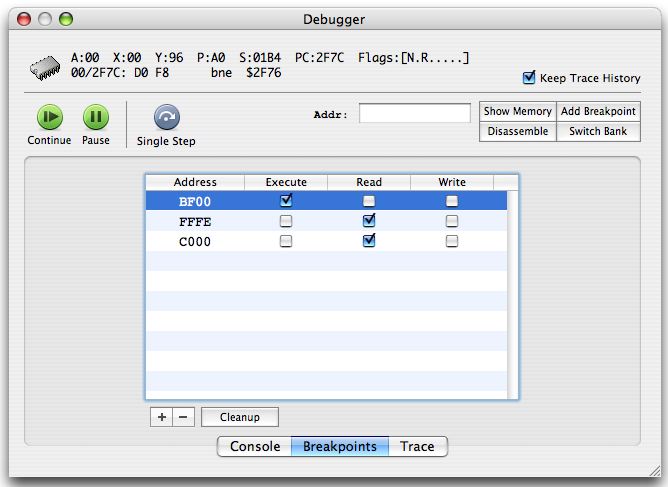
Breakpoints can be set on when the program counter, when a memory address is read or written to.
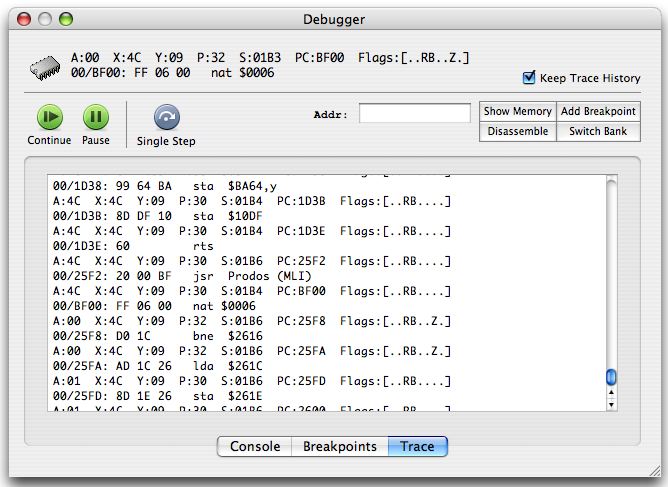
Trace History allows you to actually watch every change made while the CPU is running, each execution of an OPCODE includes the current registers, CPU status. You can literally watch as loops unfold and data is accessed.
With the completion of the Debugger, the next step is adding the 65c02 opcodes needed to continue emulation.
Finally, note the subtle change in name (you did catch it in the first paragraph, right?). Due to the pathname issue, I decided to go with Deja IIx instead of Deja //x.